Understanding and Implementing Data Grids - Complete Guide

Understanding and Implementing Data Grids - Complete Guide
What is a Data Grid?
A data grid is an interactive component used to display, organize, and manipulate structured data within a user interface. Unlike basic HTML tables, these components offer advanced functionality, including styling, merge and split cells, setting headers, and nesting, making them crucial tools for developers working with large datasets.
These interactive components are extensively used in enterprise applications, content management systems, and financial software to enhance information presentation and interaction. They allow users to seamlessly handle complex tasks without relying on external spreadsheet software.
Understanding Data Grids
The power of interactive tables lies in their ability to transform static content into dynamic interfaces that improve accessibility, usability, and efficiency. Developers, engineers, and business professionals leverage these components for various applications, including managing customer records, tracking financial transactions, and optimizing workflow processes. With Paste from Excel, users can easily bring structured data from external sources directly into CKEditor 5, ensuring easy integration and preserving critical formatting.
Key features of modern interfaces include:
- Inline Editing: Modify content directly without switching interfaces
- Sorting & Filtering: Organize information dynamically for better accessibility
- Cell Formatting: Structure numerical and textual information efficiently
- Accessibility Compliance: Ensure compatibility with assistive technologies
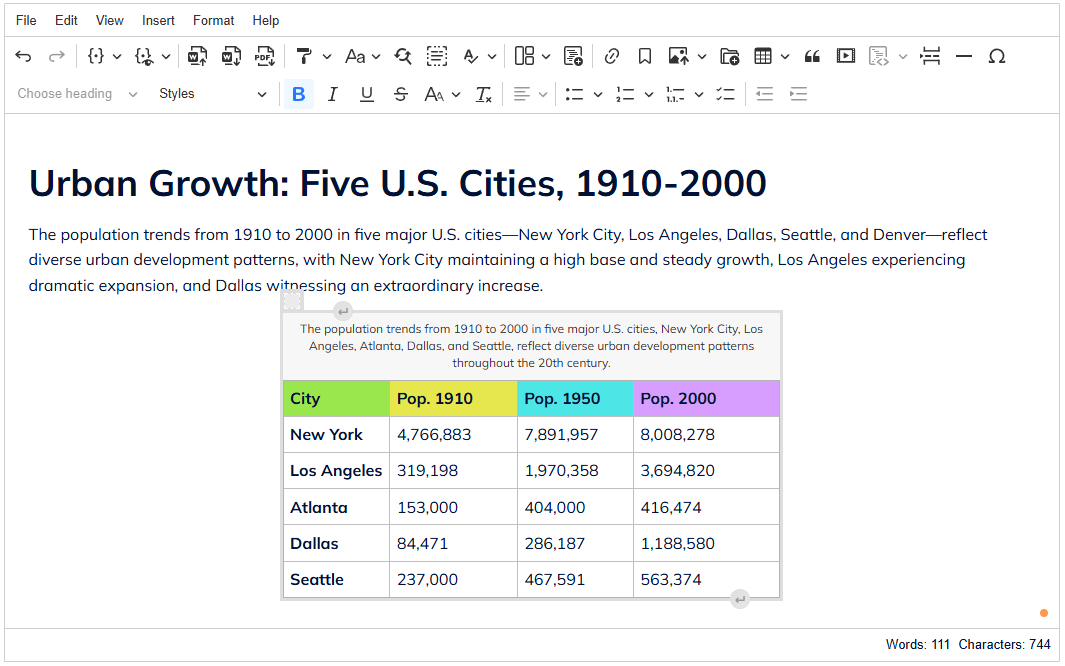
Data Grid Example
The practical implementation of interactive tables in modern web applications demonstrates the versatility of these components. The table features within CKEditor 5 showcase this transformation, offering features such as column resize with your mouse or custom table formatting. Users can seamlessly manipulate columns, apply styling and formatting, and handle large datasets without performance degradation.
For a hands-on demonstration of these capabilities, visit the CKEditor 5 Table and Cell Styling Demo which provides an interactive walkthrough of these features. This comprehensive demo illustrates how users can create complex data structures, and manage large datasets efficiently. Visitors can experiment with features like cell merging, background color adjustment, and header row configuration, all while experiencing the responsive and user-friendly interface firsthand.
React Data Grid Components
The React ecosystem has revolutionized how developers approach component-based architecture, and interactive table implementations have evolved accordingly. When implementing a data grid in React applications, developers benefit from the framework’s efficient rendering and state management capabilities. Handsontable and similar solutions demonstrate the power of React’s component model when applied to complex data visualization challenges.
These implementations leverage React’s virtual DOM to optimize performance when handling large datasets, while maintaining responsive user interfaces and smooth scrolling capabilities. Real-time collaboration features become more manageable through React’s state management patterns, enabling multiple users to work simultaneously on shared datasets. The integration with modern frontend workflows allows developers to implement complex features like cell virtualization, frozen columns, and custom cell renderers while maintaining clean, maintainable code.
Documentation and API for Data Grids
Modern web applications require flexible, well-documented APIs to support a wide variety of implementation requirements. CKEditor 5’s documentation guides developers through every aspect of table implementation. This includes the available API available calls, enabling easy integration with backend services. Developers can implement custom sorting algorithms, filter conditions, and data transformation pipelines through clean, intuitive interfaces.
The Purpose and Benefits of Data Grids
Interactive table components serve as the foundation for modern data management interfaces, transforming how organizations handle complex information sets. In financial services, analysts use these tools to process market data, perform real-time calculations, and generate sophisticated reports. Healthcare professionals rely on them to manage patient records, track treatment histories, and analyze clinical data.
The education sector implements these components to manage student records, track academic progress, and analyze performance metrics. The technology’s ability to handle complex calculations, maintain data integrity, and provide immediate feedback has made it indispensable across industries. When managing financial reports or tracking customer interactions, these interfaces reduce cognitive load on users while increasing data accuracy and processing speed. The combination of powerful filtering capabilities, instant search functionality, and customizable views enables users to extract meaningful insights from complex datasets efficiently.
Accessible Data Grid Design
Creating truly inclusive web applications requires careful consideration of accessibility in every component, particularly in complex data management interfaces. Modern design principles emphasize the importance of keyboard navigation patterns that mirror natural user workflows. Screen reader compatibility goes beyond basic ARIA labels, incorporating meaningful context and clear feedback for every user action. The implementation considers various visual impairments through carefully chosen color contrasts, scalable typography, and flexible layout systems.
Focus management becomes crucial in complex interfaces, ensuring users can navigate through large datasets without losing their position or context. High-contrast themes and customizable font sizing accommodate different visual needs while maintaining the interface’s functionality. Voice control integration enables hands-free operation, while careful keyboard shortcut design ensures efficient navigation for power users. The documentation includes guidance on testing with various assistive technologies and implementing progressive enhancement strategies.
Creating and Customizing Interactive Tables
Follow these steps to create your table:
- Click the Table button in the toolbar
- Choose the number of rows and columns required
- Click inside the table to begin entering data

Basic Table Operations:
- Add or delete rows and columns dynamically
- Set header rows and columns for better data organization
- Align text within cells in any direction (left, right, center, justify)
Merge and Split Cells
- Merge cells both horizontally and vertically
- Split cells vertically and horizontally
Table Styling and Resizing:
- Customize border properties including color, style, and width
- Apply background colors to cells
- Resize columns by dragging their edges
Table Captions:
- Add descriptive captions to tables
- Toggle caption visibility as needed
For additional information, check out the CKEditor 5 table documentation page.
Conclusion
Interactive tables play a crucial role in structuring and presenting information efficiently. Whether using CKEditor 5’s Table Spreadsheet feature or leveraging other components, organizations benefit from improved usability and performance.
Ready to enhance your content management? Sign up for a 14-day commitment-free trial or contact us for more information.
This post was originally published on